Market Recap
In the second quarter of 2024, the U.S. economy remained resilient in an environment where inflation and interest rates remained higher than expectations. Tighter monetary policy was offset by accommodative fiscal policy, and a still strong US consumer.
The S&P 500 Index gained nearly 4.5% in the quarter, reaching a new all-time high. Gains were again led by technology stocks with the Nasdaq gaining over 8.0% in the quarter. Chip-maker Nvidia became the world’s most valuable company in late-June after its share price climbed to an all-time high, making it worth $3.34 trillion, with its price nearly doubling since the start of this year. We also saw the continuing trend of large-cap stocks (Russell 1000 Index) outperforming small-cap stocks (Russell 2000 Index) and growth (Russell 1000 Growth) beating value (Russell 1000 Value).
Overseas, results were mixed with developed international stocks (MSCI EAFE) falling 0.2%, while emerging markets stocks (MSCI EM Index) rebounded nearly 5.0%.
Within the bond markets, returns were positive across most fixed-income segments. The benchmark 10-year Treasury yield ended the quarter close to where it started, but interest rates were volatile in the period. The 10-Year Treasury yield started at 4.20%, rose to 4.70% before coming back to the mid-4.20% range. In this environment, the Bloomberg U.S. Aggregate Bond Index gained 0.3% while high-yield bonds (ICE BofA High Yield Index) finished up 1.0% in the quarter.
Investment Outlook and Portfolio Positioning
During the second quarter, the U.S. economy began its fifth year of expansion after the brief pandemic-related recession in April 2020. Ongoing economic growth has defied widespread expectations of a recession that were present for most of 2023 and into the beginning of 2024.
Concerns about an economic recession were due to the Fed’s rapid and meaningful increase in the Fed Funds rate (i.e., interest rates) and the potential negative impact they would have on economic growth. The Fed’s rapid increase in the Fed Funds rate resulted in an inverted yield curve with short term interest rates above intermediate-and-long term interest rates. Historically, an inverted Treasury yield curve has been a reliable predictor of economic recession.
However, as I’ve communicated for several quarters, my view was that given the elevated level of inflation, Fed policy may not have been as restrictive as it seemed and thus, a recession was not imminent. My view was largely based on the level of the real Fed Funds rate (Fed Funds Rate minus inflation) and prior recessions. The chart below shows the real fed funds rate (blue line) and the shape of the Treasury curve (green line). When the green line is above zero it indicates a normally (upward) sloped yield curve and below zero represents an inverted (downward sloped) yield curve. The vertical gray bars indicate a recession.
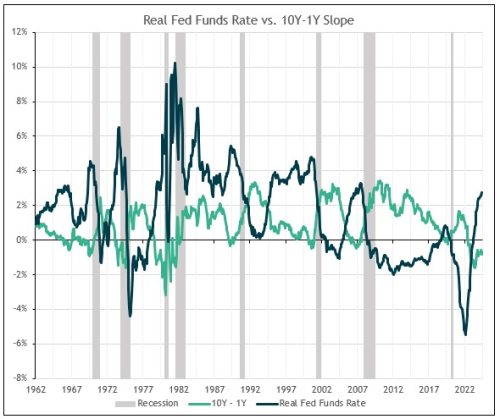 We can see that while the yield curve has been inverted since July 2022 (i.e., the green line is below zero), Fed policy was very accommodative for most of that time (i.e., the real Fed Funds rate was sharply negative when the curve first inverted). It’s only more recently been that Fed policy started to move toward restrictive levels. In prior cycles, real Fed Funds proved restrictive at the 3.5% (or higher) level. To the extent that inflation continues declining, which I think it will, and the Fed keeps rates unchanged, Fed policy will become proportionately tighter, and slow the economy.
Indeed, recent data suggests that higher interest rates and inflation have started to take a bite out of the US consumer. The University of Michigan Consumer Sentiment Index fell to a seven-month low in June, indicating a pessimistic view of personal finances. In the May retail sales report, growth was positive but slower than expected. This recent data point suggests consumers are exercising more caution amid tighter budgets. Specifically, headline sales rose 0.1% from the prior month versus the consensus for a 0.3% rise.
At this point, I would describe the slowdown in consumer spending as a normalization after a period of splurging, rather than something more ominous. So far, any concerns around the consumer have not seemed to scare investors as the S&P 500 has made 30 new highs and as the economy has grown at nearly 3% (after inflation) over the past four quarters. My base-case is for the economy to continue growing, albeit at a slower pace, for inflation to grind lower, and the backdrop for risk assets to remain supportive (for at least a while longer). That said, I will closely monitor the labor market and the consumer for signs of further deterioration, which could impact my views and portfolio positioning.
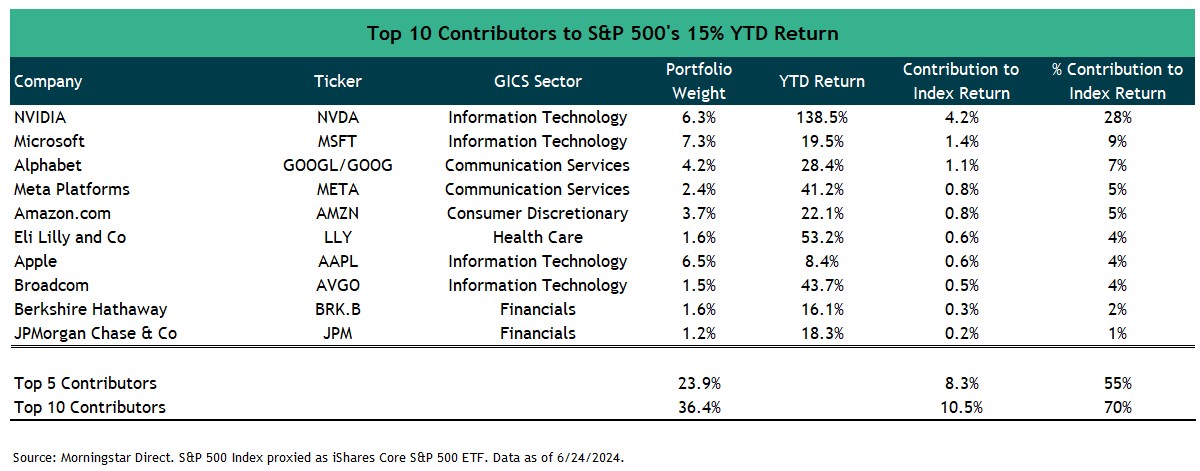
Within US equity markets (S&P 500 Index) a handful of U.S. mega-cap technology stocks continue to lead way higher. Last year just 30% of stocks within the S&P 500 outperformed the index. This was a historically low figure— a level not seen since the late-1990s. Yet, so far in 2024, the concentration of returns moved even higher. Through late June 2024, only 27% of stocks are outperforming the S&P 500. This is lowest reading on record going back more than 50 years. As shown in the table below, the top 10 contributors in 2024 have accounted for 70% of the S&P 500’s 15% year-to-date return.
While the concentration levels at the index level are noteworthy, it’s possible that this trend can continue. Afterall, the strong run for Artificial Intelligence (AI) stocks has been justified as companies such as Nvidia continue to deliver and beat earnings estimates. Moreover, expectations for future earnings growth are robust.
My portfolios have meaningful exposure to many of these strong-performing mega-cap stocks, which has benefitted portfolio performance. But I remain balanced, also owning larger-cap value and smaller-cap U.S. stocks that are trading at more attractive valuations and offer important diversification benefits. Smaller-cap U.S. stocks, for example, are trading at valuations relative to large-cap stocks that haven’t been seen in years, dating back to the late 1990’s. I should also note that I think it’s quite possible that areas of the equity market that have lagged and have lower valuations—small-cap companies and value stocks—could benefit from an ongoing expansion and a broadening out of the market rally.
Outside of the U.S., there are many compelling opportunities in developed international (MSCI EAFE) and emerging-market stocks (MSCI EM) in portfolios. Europe, for example, is home to several leading businesses in a range of growing and attractive sectors. Companies such as Novo Nordisk has seen its stock price double over the past two years following the successes of its type-one diabetes drug Ozempic, and its weight-loss drug, Wegovy. Novo Nordisk is now Europe’s largest company. Within the consumer discretionary sector there are world-leading European luxury brand companies such as Louis Vuitton, which now also constitutes a significantly larger proportion of the European equity index (MSCI Europe), as it has benefited from growing consumption from the rising middle-class populations in emerging economies.
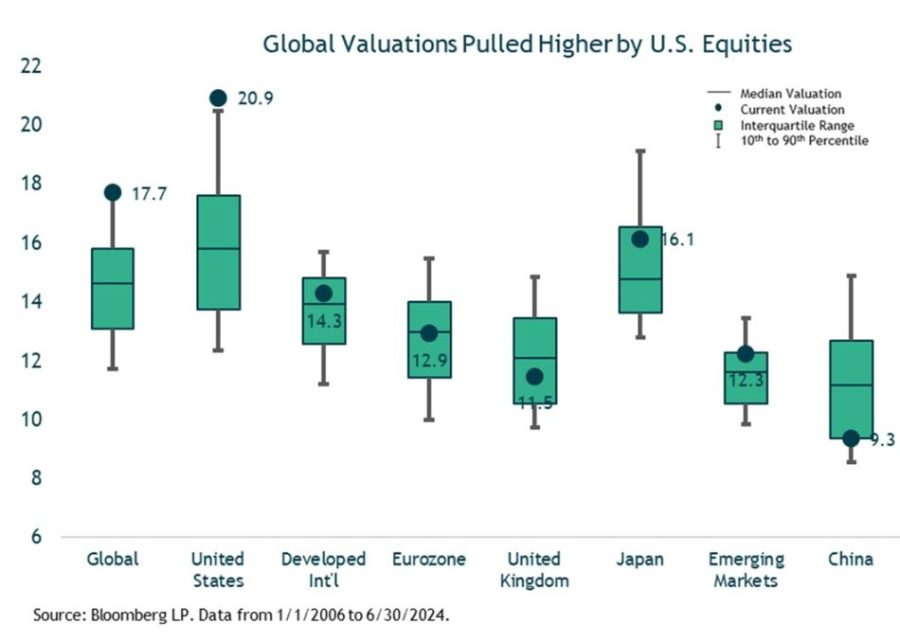
From a valuation perspective, the discount for developed international (MSCI EAFE) and emerging-market stocks (MSCI EM) versus the U.S. remains extremely wide. The story can be seen in the chart below. U.S. stocks trade near peak valuations, while other regions offer better relative values as their valuations are not as extended. All else equal, lower starting valuations imply better long-term expected returns and should provide more of a valuation cushion in the event multiples contract in a stock market sell-off.
In my fixed income positioning, I continue to take advantage of the inverted yield curve, maintaining meaningful exposure to shorter-term bonds, emphasizing shorter-term higher yielding securities with yields in the 6.5% to 7% range. At the same time, I’m also keeping healthy exposure to longer-term investment grade corporate bonds with yields in the 4.5% to 5% range, which can also provide a potential hedge in the event of an unforeseen downturn in the stock market
Closing Thoughts
The U.S. economy looks set to benefit from a continuing gradual moderation in growth, inflation, and jobs, creating a backdrop that could support risk assets. As was the case last quarter, the stock market continues to hit new highs as economic growth continues to benefit corporate earnings. U.S concentration remains high with the Magnificent Seven representing over 25% of the S&P 500. There’s no doubt that the other 493 stocks of the S&P 500 have struggled on a relative basis, but they could be set to move higher if the key economic drivers outlined above continue to fuel the economy. That said, fears of a recession haven’t completely abated. Looking out to the end of the year and into next year, the question remains whether a recession will be avoided or delayed. As such, I am keeping a close eye on the typical drivers of recession, including the labor market, consumer spending, and corporate earnings, where a deterioration in these variables could influence portfolio positioning.
Heading into the second half of the year, I continue to anticipate pockets of volatility given headline risks related to Fed policy, geopolitical events, and the upcoming U.S. presidential election. In the event of volatility, I will look to be opportunistic, taking advantage of any attractive risk/reward opportunities that arise.
I thank you for your continued confidence and trust.
—Jeff (7/12/2024)
Certain material in this work is proprietary to and copyrighted by iM Global Partner Fund Management, LLC and is used by Bogue Asset Management LLC with permission. Reproduction or distribution of this material is prohibited and all rights are reserved.